
Warren Buffett Indicator reaches record 236%, surpassing dot-com peak by a wide margin
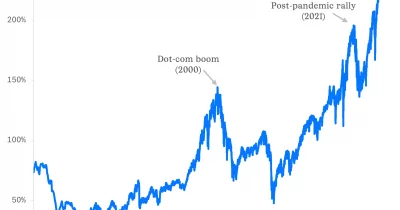
The Warren Buffett Indicator, which measures total stock market capitalization relative to GDP, reached an unprecedented 236% in May 2026, dramatically exceeding the dot-com bubble peak of 145-159%. This metric suggests significant overvaluation in global equity markets and raises concerns about potential market correction risks for investors.
The Warren Buffett Indicator serves as a macroeconomic barometer for asset valuation relative to underlying economic output. When the ratio exceeds 100%, it indicates stocks trade above historical norms relative to GDP, signaling potential overvaluation. The current 236% reading represents a stark departure from historical precedent, including the infamous dot-com bubble that preceded the 2000-2002 market crash.
Multiple factors have contributed to this extreme valuation: unprecedented liquidity from central banks during the post-pandemic era, explosive growth in artificial intelligence and technology sectors, retail investor participation through accessible trading platforms, and sustained low interest rates through much of the cycle. The cryptocurrency and blockchain sectors have amplified this dynamic by attracting speculative capital flows and creating new asset classes that inflate broader market capitalization figures.
For investors, this metric suggests heightened downside risk despite continued nominal market strength. Historical precedent indicates that such extreme readings often precede significant market corrections, though timing remains uncertain. The divergence from the dot-com peak implies either structural economic changes that justify higher valuations or a bubble of unprecedented proportions building across multiple asset classes simultaneously.
Market participants should monitor economic indicators, corporate earnings growth, and interest rate trajectories closely. If GDP growth fails to keep pace with equity valuations, or if central banks tighten monetary policy further, compression from current levels could occur rapidly. The cryptocurrency sector, being highly correlated with risk-on sentiment, would likely experience pronounced volatility in such a scenario.
- →Warren Buffett Indicator hit record 236% in May 2026, exceeding dot-com peak by 77 percentage points
- →Extreme readings historically precede market corrections, suggesting elevated downside risk for equities
- →Post-pandemic liquidity, AI sector growth, and retail participation have driven valuations to unprecedented levels
- →Cryptocurrency and blockchain assets amplify broader market capitalization dynamics during valuation extremes
- →Investors should monitor GDP growth, earnings, and monetary policy as key indicators of correction probability